Thursday, December 23, 2010

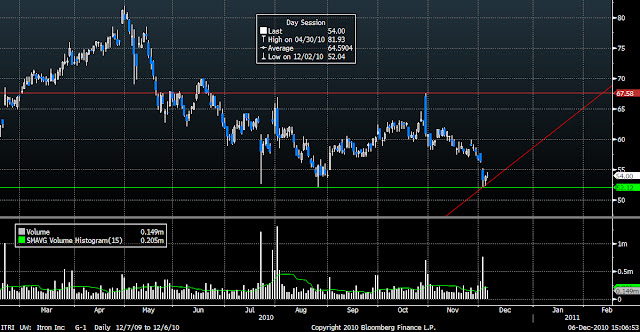
Itron Inc. (NASDAQ: ITRI) Q1 2011 Analysis

Recent price: 54.73$
P/E Ratio: 25.45
3 month Target Price: 62$


Company Description
Itron Inc. is a leading technology provider to the global energy and water industries. The company is the world’s leading provider of intelligent metering, data collection and utility software solutions, with nearly 8,000 utilities worldwide relying on their technology to optimize the delivery and use of energy and water. Their products include electricity, gas, water and heat meters, data collection and communication systems, including automated meter reading (AMR) and advanced metering infrastructure (AMI); meter data management and related software applications; as well as project management, installation, and consulting services.


Confidence Margins
Strong resistance $67.58 (+23%)
Light resistance $63.70 (+16%)
Light support $52.12 (-5%)
Strong support $47.10 (-14%)


Recommendation
The recent price drop of the company's stock is due to a recent recommendations by Goldman Sachs analyst Mark Wienkes. His rationale is that ITRI will see a slump in sales in the coming years, but in the meantime, it remains a bargain at current prices and should see some interesting upside in the coming months due to it's oversold status. This is an interesting position for the coming months and calls for a bullish position.

Entry strategy
For the cautious investor:
Buy the stock for 55$ or less.


For the risk-taking trader:
The best thing to do here is to purchase the February 2011 65$ call option contracts. They should yield the highest return as the stock gets closer to it's target price.


Exit Strategy
For the cautious investor:
Sell when the stock reaches 63$, or keep it until 67$ if you are very bullish.


For the risk-taking trader:
Since the options price depend greatly on the price of the underlying security, the time to sell is the same as for the cautious investor. The investor must keep a look for any drop in the stock price that would cross a support line as it will have a disproportionate affect the option prices.

Tuesday, November 2, 2010

Joe’s Jeans, Inc (NASDAQ: JOEZ) Q4 2010 Analysis

Recent price: 1.63$
P/E Ratio: 4.52
3 month Target Price: 2.43$

Company Description
Joe's Jeans Inc. ("Joe's") designs, sources and distributes its Joe's® and Joe's Jeans™ branded apparel products to over 1,200 retail doors in the U.S. and abroad. With its competitive advantages and industry expertise in denim-wear and denim-related products, Joe's produces one of the most recognized and sought-after premium denim brands in the world. Joe's products are designed internally and sourced to specification from suppliers primarily located in the U.S., Mexico and Morocco. Finished goods are then distributed directly to Joe's customers from its distribution center in Los Angeles. Joe's maintains third party showrooms in New York and Los Angeles to showcase its Joe's® and Joe's Jeans™ products for its customers. Joe's has recently has opened a branch office in Paris to distribute its products in Europe.

Confidence Margins
Strong resistance  $3.60 (+121%)
Light resistance  $2.43 (+49%)
Light support  $1.50 (-8%)
Strong support  $1.10 (-33%)

Recommendation
Because of poor quarterly results, JOEZ has been punished by its investors in the means of a huge oversell. The RSI just got over the oversold position and the MACD has bottomed. It is the right time to buy for the coming quarter.

Entry strategy
For the cautious investor:
Buy the stock for 1.70$ or less.

For the risk-taking trader:
Since there are no option contracts for this stock, the suggested strategy is to use your margin to leverage the position of the cautious investor.
There needs to be a close attention paid to this position. It has a great potential profit, but the downside is still pretty high.

Exit Strategy
For the cautious investor:
Sell when the stock reaches 2.40$, or keep it until 3.00$ if you are very bullish.

For the risk-taking trader:
Same as the cautious investor. However, one needs to keep an eye on the position to make sure not to incur large losses should the position turn sour.

Monday, November 1, 2010

Oclaro, Inc (NASDAQ: OCLR) Q4 2010 Analysis

Recent price: 8.62$
P/E Ratio: 51.81
3 month Target Price: 19.07$

Company Description
Oclaro, with headquarters in San Jose, California, is a Tier 1 provider of innovative optical and laser components and solutions for a broad range of diverse markets, including telecommunications, industrial, consumer electronics, medical and scientific applications. The company is on a mission to be a predominant force in the optical industry, and has been making bold moves to establish a leadership position in each of the markets it serves, expand its addressable market, and increase its share of existing markets.

Confidence Margins
Strong resistance $15.99 (+85%)
Light resistance $14.12 (+64%)
Light support $8.00 (-7%)
Strong support $6.10 (-29%)

Recommendation
This is a company that has been punished by its investors. This will prove to be a very profitable trade because it has already seen much of the downside after its earnings release.

Entry strategy
For the cautious investor:
Buy the stock for 8.70$ or less.

For the risk-taking trader:
Buy the 17.50$ January 2011 out of the money call options for about 10$ a contract.
This position will require the investor to keep an eye on his portfolio to make sure he doesn’t endure any unplanned losses. The support levels imply a mild possibility for the stock to reach them.

Exit Strategy
For the cautious investor:
Sell when the stock reaches 14$, or keep it until about 16$ if you are very bullish.

For the risk-taking trader:
These options are currently undervalued because investors assume that there should not be much movement upwards for this stock. Sell them if the stock reaches the same levels as in the case of the cautious investor.

Kulicke & Soffa Industries Inc. (NASDQA: KLIC) Q4 2010 Analysis

Recent price: 7.33$
P/E Ratio: -
3 month Target Price: 8.20$

Company Description
Kulicke & Soffa Industries is a global leader in the design and manufacture of semiconductor assembly equipment. As one of the pioneers of the industry, K&S has provided customers with market leading packaging solutions for decades. In recent years K&S has expanded its product offerings through strategic acquisitions, adding die bonding, wedge bonding and a broader range of expendable tools to its core ball bonding products. Combined with its extensive expertise in process technology, K&S is well positioned to help customers meet the challenges of assembling the next-generation semiconductor devices

Confidence Margins
Strong resistance $8.21 (+12%)
Light resistance $7.50 (+2%)
Light support $6.65 (-9%)
Strong support $6.00 (-18%)

Recommendation
This is a very speculative trade because the company has experienced losses over the last year. The company should however be able to surprise analysts. However, due to improving economic conditions, this trade could be very profitable.

Entry strategy
For the cautious investor:
Buy the stock for 7.33$ or less.

For the risk-taking trader:
Buy 8$ December out of the money call options for about 10$ a contract.
Because of the speculative aspect of this trade, try to keep the supports on watch if you feel uncomfortable with a potential downward movement.

Watch the stock closely as the earning release date approaches. If the resulting price is satisfying, sell the call options as an up price movement happens.

Exit Strategy
For the cautious investor:
Sell when the stock reaches 8.20$, or keep it until about 9.00$ if you are very bullish.

For the risk-taking trader:
These options are currently undervalued and their prices anticipate a negative earnings report from the company and they should greatly appreciate following a positive move of the stock.

Sunday, October 31, 2010

99 Cents Only Stores (NDN) Q4 2010 Analysis

Recent price: 16.34$
P/E Ratio: 16.84
3 month Target Price: 17.75$

Company Description
99¢ Only Stores is a unique deep-discount retailer of primarily name-brand consumable general merchandise. We have always delivered great value to our customers, and in these challenging economic times, we are "The Right Store...Now More Than Ever!" They provide a primary shopping destination for price-sensitive consumers and a fun treasure-hunt shopping experience for other value conscious consumers. They accomplish this by offering excellent values on a wide selection of quality food and basic household items with a focus on name brands and an exciting assortment of “wow” items.

Their stores are attractively merchandised, clean, full service "destination" locations that offer customers significant value on their everyday household needs in a fun shopping environment. Merchandise encompasses a wide array of name brand closeouts and regularly available consumable products including food and beverages such as produce, deli, and other basic grocery items.

Confidence Margins
Strong resistance $19.07 (+17%)
Light resistance $17.75 (+9%)
Light support $15.75 (-4%)
Strong support $15.10 (-8%)


Recommendation
The NDN stock has recently suffered a large selloff due to a lowering of their revenue guidance. This will be a great opportunity for the coming quarter.

Entry and Exit Strategy
For the cautious investor:
Buy the stock for 16.25$/share or less.

For the risk-taking trader:
Buy 22.50$ March 2011 out of the money call options for about 20$/contract or less. The stock is trading inside a channel defined buy the light resistance and the light support. Selling when the stock is at the higher end of the channel will be cautious and profitable.

For the cautious investor:
Sell when the stock reaches 17.75$, because of the light resistance or keep it until about 19$ if you are very bullish.

For the risk-taking trader:
The announcement of quarterly results should trigger an interesting price movement since the market anticipates them to be bad. A good thing to do would be to hold the contracts until the stock reaches the light resistance

Duke Energy Corporation (NYSE: DUK) Q4 2010 Analysis

Recent price: 17.65$
P/E Ratio: 35.71
3 month Target Price: 18.10$

Company Description
Duke Energy makes life better for millions of people every day by providing electric and gas services in a sustainable way – affordable, reliable and clean.

They are one of the largest electric power companies in the United States, supplying and delivering energy to approximately 4 million U.S. customers. They have approximately 35,000 megawatts of electric generating capacity in the Carolinas and the Midwest, and natural gas distribution services in Ohio and Kentucky. Our commercial and international businesses own and operate diverse power generation assets in North America and Latin America, including a portfolio of renewable energy assets.
Headquartered in Charlotte, N.C., Duke Energy is a Fortune 500 company traded on the New York Stock Exchange


Confidence Margins
Strong resistance  $18.75 (+6%)
Light resistance  $18.10 (+3%)
Light support  $17.50 (-1%)
Strong support  $16.75 (-5% )


Recommendation
This is a stock to hold very shortly since the RSI is getting closer to 70; this means there might be limited upside potential after that.

Entry strategy
For the cautious investor:
Buy the stock for 17.65$ or less.

For the risk-taking trader:
Buy 18$ December out of the money call options for about 19$ a contract.


Exit Strategy
For the cautious investor:
Sell when the stock reaches 18.10$, or keep it until about 18.75$ if you are very bullish.

For the risk-taking trader:
These options are currently undervalued and they should greatly appreciate following a positive move of the stock.
If the resulting price is satisfying, sell the call options as an up price movement happens.

DSP Group, Inc. (NASDAQ: DSPG) Q4 2010 Analysis

Recent price: 7.33$
P/E Ratio: -
3 month Target Price: 8.21$

Company Description
DSP Group, Inc is a leading global provider of wireless chipset solutions for converged communications at home. Delivering system solutions that combine semiconductors and software with reference designs, DSP Group enables consumer electronics manufacturers and service providers to cost-effectively develop innovative revenue-generating applications with fast time to market. DSP Group provides a broad portfolio of wireless chipsets integrating DECT, Wi-Fi, PSTN and VoIP technologies with state-of-the-art application processors. With a growing share of the wireless home telephony market, the Company provides comprehensive solutions supporting all major digital cordless technologies worldwide.

DSP Group serves a broad customer base including leading CE brands, original equipment manufacturers, original design manufacturers, telecommunications operators and service providers. Enabling converged voice, audio, video and data connectivity across diverse consumer products – from cordless and VoIP phones to home gateways and connected multimedia screens – DSP Group proactively partners with CE manufacturers to shape the future of converged communications at home.

Confidence Margins
Strong resistance $8.21 (+12%)
Light resistance $7.50 (+2%)
Light support $6.65 (-9%)
Strong support $6.00 (-18%)

Recommendation
DSPG is currently in an uptrend and still has a lot of potential for growth over the next quarter.

Entry Strategy
For the cautious investor:
Buy the stock for 7.33$ or less.

For the risk-taking trader:
Buy the stock for 7.33$ or less; you might use some leverage to increase the payout from this trade while paying little interest considering the short holding period. If the stock goes under the light support level, you might want to consider closing the position if you cannot bear to have your position temporarily getting to your strong support.

Exit Strategy
For the cautious investor:
Sell when the stock reaches about 8$ or keep it until about 8.20$ if you are very bullish.

For the risk-taking trader:
Same strategy as the cautious investor, except that you should consider closing the position before the light support is the use of leverage has negative effects on the position.

Microsoft Inc. (NASDAQ: MSFT) Q4 2010 Analysis

Recent price: 25.82$
P/E Ratio: 12.23
3 month Target Price: 29.75$

Company Description
Microsoft Corporation is engaged in developing, manufacturing, licensing and supporting a range of software products and services for different types of computing devices. Its software products and services include operating systems for personal computers, servers and intelligent devices; server applications for distributed computing environments; information worker productivity applications; business solutions applications; computing applications; software development tools, and video games. It operates in five segments: Windows & Windows Live Division (Windows Division), Server and Tools, Online Services Division, Microsoft Business Division, and Entertainment and Devices Division. It also designs and sells hardware, including the Xbox 360 gaming and entertainment console and accessories, the Zune digital music and entertainment device and accessories, and Microsoft personal computer (PC) hardware products.

Confidence Margins
Strong resistance  $29.75 (+15% )
Light resistance  $26.40 (+2%)
Light support  $23.80 (-8%)
Strong support  $23.40 (-10%)

Recommendation
As a major player, the company has been severely punished by the market. Most investors expect it to perform very badly on their next earnings report.

Entry and Exit Strategy
The performance will greatly depend on their next earnings report; make sure to open a position before it is issued.

For the cautious investor:
Buy the stock for 25.90$ or less.

For the risk-taking trader:
Buy 27$ November 2010 out of the money call options for about 13$ a contract.

For the cautious investor:
Sell when the stock reaches 26.40$, or keep it until 29.50$ if you are very bullish.

For the risk-taking trader:
Time being a major factor in this trade; try to sell the contracts in the days following the earnings report to lock in your profits before the expiration of those contracts as the proximity of that date has a major effect on their price.

Friday, October 29, 2010

Dryships Inc. (NASDAQ: DRYS) Q4 2010 Analysis

Recent price: 4.57$
P/E Ratio: 24.05
3 month Target Price: 5.70$

Company Description
Dryships is a Marshall Islands registered company that was formed in September 2004. Their business strategy is focused on building and maintaining enduring relationships with charterers of drybulk carriers and providing reliable seaborne transportation services at competitive cost. They seek to create shareholder value by acquiring and operating second hand drybulk carriers across the size spectrum, including large (Capesize), medium (Panamax) and small (Handymax and Handysize), and employing them in a combination of "spot charter", and "period time charter" contracts and pools.

Mr. George Economou, the company’s Chief Executive Officer, has been active in shipping since 1976 and formed the Company's related technical and commercial ship-management company, Cardiff Marine Inc. in 1991. Cardiff has established a reputation in the international drybulk shipping industry for operating and maintaining a fleet with high standards of performance, reliability and safety.


Confidence Margins And Potential Profit
Strong resistance $5.70 (+25%)
Light resistance $5.00 (+9%)
Light support $4.10 (-10%)
Strong support $3.30 (-28%)


Recommendation
The company is currently close to being oversold, with the RSI index lowering and getting close to 30 and the MACD coming back to 0. The next big move in the stock price will be bullish.


Entry and Exit Strategy
For the cautious investor:
Buy the stock for 4.50$ or less.

For the risk-taking trader:
Buy 6$ December out of the money call options for about 10$ a contract. If the stock goes under the light resistance level, you might want to consider closing the position if you cannot bear to have your position temporarily getting to your strong support.

For the cautious investor:
Sell when the stock reaches 5$, due to the strong resistance or keep it until about 5.70$ if you are very bullish.

For the risk-taking trader:
Major price movements should happen when the company announces the awarding of a Rig drilling contract, or after the release of their quarterly report.
If the resulting price is satisfying, sell the call options as soon as either of those events happens.

Wednesday, September 29, 2010

FairFax Financial Spots a Deal


After months of issuing preferred shares and debentures, the insurance giant Fairfax Financial Holdings Limited is initiating one of the largest share buybacks of it's history. At yesterday's closing price, it would be valued at over $600 million. Over the next 12 months, the company will buy close to 1.6 million shares, almost 10% of the current float. This means that the average daily volume of the company will be greatly influenced by the actions of the company.

The company's Chairman and CEO, Vivan Prem Watsa, has developed a reputation of value investor over the past 20 years. Having the company dedicate more than half a billion dollars to buying it's own shares instead of increase it's current investments is a clear sign that the FFH is currently trading under or close to it's book value. This is an hypothesis that will be confirmed on the next quarterly filing of the holding company. Note also that this move will greatly increase the seize of the CEO's control stake in the company, which is already pretty close to 50%.

However, before buying the stock, one should consider taking this news with care, as the final amount of the operation is not yet known. Some companies will issue such statements to stimulate a downbeat stock price. Fairfax is up a mere 2% for the year, this is therefore another possibility. If the transaction is completely filled, the remaining shareholders will be greatly rewarded as the company will showcase higher EPS.

This might not be a good time to buy the company's stock, but for those who already own it, it is definitely a great idea to hold on to it.


Full disclosure: Long FFH.TO

Thursday, July 29, 2010

Ridley Inc. Reports Preliminary Results for Fiscal 2010 Fourth Quarter

Ridley Inc. (RCL.TO) Reports Preliminary Results for Fiscal 2010 Fourth Quarter

As stated in that MarletWatch article, the 4Q results of Ridley showcase improved operational performance for the company.

As they state it in their quarterly report, their loss has been narrowed compared to a year ago. This is good sing for a company on it's way to profitability.

Let's remind that Ridley Inc., the former subsidiary of it's Australian parent company, was sold to Fairfax Financial Holdings Limited in 2008. since then, the stock of the company has been pretty illiquid because of the large block owned by the Canadian insurer.

Their short term results have been altered by the critical conditions present in the current financial environment. Exempt from them, the company is on track for great success for their shareholders.

Depending on right assumptions, the company should yield great returns, since the parent company, Fairfax Financial Holdings Limited, should proceed to a complete buyout of the roughly 20 millions shares of that company that are still publicly traded on the Toronto Stock Exchance under the symbol RCL.TO.

Untill then, I will keep acquiring more stock in this interesting value play.

Full disclosure: Long RCL.TO

Institutional Investors and Stock Prices

In their quest to generate impressive returns to their clients, institutional investors shape the financial world. An average investor will tend to get heavily influenced by their investment choices.


Institutions generally tend to be banks, insurance companies, pension funds, mutual funds, investment trusts, unit trusts or hedge funds. They are very meaningful invertors because of the sheer size of assets that they manage.


Any individual wandering in the financial arena should consider getting more acquainted with those entities. If you are playing in the small capitalization and mid capitalization field, you should know that some of those investors shun companies that expose their stock prices to levels that they deem too low. In fact, some if those institutional investors establish minimum buying prices; in order to avoid the frequent price manipulation that incurs from companies have a too low stock price.


For most of those investors the minimum price will be set at 5$. This will explain why some companies experience huge gain in their stock price as soon as it hits that minimum price. A good example is DryShips over the past two years. However, some funds will go as low as 1$ per share.


Mass market movements are often the consequence of actions by those investors. If we take that market plunge of September 2008, one of the conclusions implies a chain reaction in the financial market.


Like any companiy, institutional investors have balance sheets and obligations towards their lenders and must maintain some capitalization levels in order to stay solvent. When news about a financial crisis were gaining grounds, many individual investors, who had their money managed by mutual funds, pension funds or companies, began redeeming their investment, thus causing a lot of stress on the cash position of those companies. Those institutional investors were forced to sell promising positions to fulfill their cash balances that were dwindling because of redemptions from clients or investors.


The investing world is a challenging one for value investors. Even if you get the right assumptions about the value of a company, institutional investors can dramatically affect your results because of their specific needs.

Tuesday, March 9, 2010

Agruim Inc (AGU): An Undervalued Fertilizer Company (Part 4)

This is the fourth part of a series of posts relating to a thorough analysis of Agrium and what led to conclude that it was a company worth your attention for a further analysis. Part one can be found here.


Agrium Inc is a Canadian retailer and manufacturer of agricultural chemicals. Its main products are fertilizer and crop protection products. Although the company operates globally, the bulk of its operations are in the US and Canada. This, however, is bound to change due to Agrium’s recent acquisition of CMF and an increasing focus on foreign markets. After evaluating Agrium Inc from different perspectives, we have come to the following conclusions:


Economic analysis: global supply and demand for crops, as well as economic conditions determine crop prices which in turn determine fertilizer prices. Crop prices, although negatively affected by the financial crisis, have been rising due to the expansion of the Asian middle-class, and the recent focus on biofuels. The world population is growing and every year there are an extra 80 million people to feed. Thus, we foresee an increase in the demand for fertilizer and also in fertilizer price.


Industry analysis: the industry as a whole was negatively affected as a whole, but things are expected to return to normal in the short to medium term with moderate growth for the sector thereafter.


Company analysis: the firm has an aggressive acquisition strategy, has shown robust growth, and has a strong management team in place.


Financial analysis: We were not able to calculate intrinsic value because ROE growth is too high! The average annual return for an investor who bought in 1995 and is still holding the stock is 13.5%. This return is higher than the expected return required by CAPM. We therefore conclude that, assuming that this growth rate is sustainable, investing in Agrium stock yields a higher expected return than that warranted by its risk. In addition, the company’s P/E ratio is lower than it’s peers, leading us to belive that it is undervalued. The stock is also currently in an uptrend: a bullish sign.


Based on all of the above information, our conclusion is that shares of Agrium Inc. are underpriced and should be bought.

Tuesday, February 2, 2010

Agruim Inc (AGU): An Undervalued Fertilizer Company (Part 3)

This is the third part of a series of posts relating to a thorough analysis of Agrium and what led to conclude that it was a company worth your attention for a further analysis. Part one can be found here.

Dupont Model analysis

Net profit margin:
Between 2007 and 2008, the net profit margin went from 8.37% to 13.18%, a significant increase of almost 5%. In 2008, the industry had an average profit margin of 5.19%. This increase in profit margin is mainly due to savings in general and administrative expenses, depreciation expenses and other non-operating income. (Annual report 2008)

Asset turnover:
The asset turnover increased from 1.16 to 1.28 between 2007 and 2008. Each dollar invested in the asset generates 1.28$ of sales. The industry’s ratio in 2008 is 1.02. Hence, Agrium’s asset was used efficiently.

Financial leverage (Asset/Equity):
2007-2008: It went from 1.89 to 2.39 meaning the company incurred more debt. This is due to the acquisition of CMF.

2008
EBIT/Assets: 0.2
Interest/Liabilities: 0.018
Positive leverage, it’s a favourable debt, so when asset on equity increases ROE increases

Profitability

Both EBITDA Margin and Gross margin increased from 2007 to 2008 and both are above the industry level thanks to the growth in sales.

ROA (net profit margin x asset turnover):
Almost doubled from 9.69 (2007) to 16.84 (2008) because of net profit growth.

Liquidity Management

Current Ratio:
Between 2007 and 2008, Agrium’s ratio decreased from 2.83 to 1.82, while the industry average raised from 2.26 to 2.94.

Quick ratio:
2007 and 2008 the ratio decreased from 1.84 to 0.57 and a constant 1.3 for the industry.

The company may have some liquidity problems after the new acquisitions. To begin with, the company’s ratio is lower than the one of industry. The difference between the current ratio and the quick ratio demonstrates that the company holds to many inventories which are often less liquid. As a result, Agrium may face short term reimbursement challenges.

Debt Management

Interest Coverage:
2008: 18.91 ≥ 1, therefore Agrium is able to pay the interest.

Total Debt to Equity:
An increase from 0.25 (2007) to 0.39 (2008) with an almost constant industry ratio of 0.29
This is due to the new issued long term debt. As we observe an raise in the LT Debt to Equity ratio from 0.25 to 0.39.

Asset Management/productivity

Receivable turnover:
Still below the industry because of high accounts receivable

Inventory turnover:
Diminished from 6.17 (2007) to 4.99 (2008), and it’s still below the industry’s ratio (7.6). The reason of the low inventory turnover ratio is because of the high amount of inventories.

Property Plant & Equip Turnover:
Both ratio in 2007 (3.39) and in 2008 (5.24) are higher than the ones of industry. This represents 1$ of capital assets generates 5.24$ of sales.

Cash & Equivalents Turnover:
In 2007, 6.39, lower than the industry (14.78)
In 2008, 13.04, got better, but still lower than the industry (16.15)
This shows possible liquidity problem.

Quality of managers

Evaluating management quality objectively is quite a difficult task. If we compare the performance of Agrium to its peers, we can see that Agrium is much more efficient. Given Agrium’s stellar performance, we assume that management must be doing something right. In addition, we watched Agrium’s conference call and we found that they left a good first impression. They seemed like diligent and competent people. It is also worth noting that Agrium’s CEO, Mike Wilson, was honoured as business person of the year by Calgary Inc magazine for his various accomplishments that made Agrium a “strong, vibrant international corporation.” Last year, Agrium’s CFO, Bruce Waterman, was nominated Canada’s CFO of the year by PricewaterhouseCoopers LLP.

Company prospects

Despite of the unprecedented bad year for fertilizer in 2008-2009 that was due to the economic downturn, Agrium is expecting strong future growth in its retail and wholesale divisions. Indeed, Agrium is poised to benefit from the strong agricultural forecast. Based on its growth strategy and value-creation throughout the supply chain, the company plans to expand wholesale operations to further optimize earnings. It has planned strategic acquisitions and other expansion/growth initiatives across the agricultural value chain: 9 acquisitions ($3.5 billion invested) and other growth initiatives (Potash expansion of 40% increase in capacity by 2013 well on its way, nitrogen production facility in Egypt on schedule, ESN expansion, etc.), in addition to its 4 acquisitions in Retail in North and South America (over $3 billion invested). As shown in the graph below, Agrium’s goal is to double earnings from stable Retail and AAT base, and significantly grow capacity across all three nutrients.

Friday, January 22, 2010

Agruim Inc (AGU): An Undervalued Fertilizer Company (Part 2)

This is the second part of a series of posts relating to a thorough analysis of Agrium and what led to conclude that it was a company worth your attention for a further analysis. Part one can be found here.

Agricultural market fundamentals remain strong
As we know, the price of fertilizer is closely related to the price of grains. The cereal harvest reached world record levels in 2008. The United States Department of Agriculture (USDA) estimates that 2,225 million metric tonnes (Mt) were harvested and that cereal inventories went up slightly. The Food and Agriculture Organization of the United Nations (FAO) and USDA estimate that the 2009 cereal crop was 1.5 to 2.0% lower than the 2008 record. Because of the recession, world grain demand will increase only modestly in 2009/10 and the world output would match demand, resulting in relatively stable inventories. Affected by the economic context, crop prices dropped in the second half of 2008 before slightly firming in the first half of 2009. Most international prices for agricultural commodities are currently relatively strong compared to pre-2008 levels.

Global Fertilizer Demand
After years of increasing demand, fertilizer use slowed in 2008. Like other commodities, the worldwide economic downturn is the primary reason for the declining fertilizer use, dropping prices and mounting inventories for the year 2008-2009. World fertilizer consumption seen as dropping 5% in 2008/09, negatively affecting the demand compared with the previous year. Nitrogen has been much less affected, as this nutrient is vital for crop yields. Nitrogen, Phosphorous and Potassium fertilizer demand is estimated to drop by 1.6, 7 and 14%, respectively. The largest contractions in volume are observed in Western and Central Europe, North America and Latin America which, coincidentally, are all of the areas in which Agrium operates.

Global Fertilizer Supply
The world fertilizer markets experienced a period of huge volatility in 2008 despite strong demand fundamentals. The global economic downturn and tight credit dampened short-term prospects for fertilizer consumption. Fertilizer market conditions worsened considerably in the fourth quarter of 2008 as sales collapsed, driven by weakening financial and economic conditions, tight credit access and, to a certain extent, loss of fertilizer demand or purchase deferral in a large number of consuming countries.

In 2008, global nitrogen production rose by a meagre 1.7% compared with 2007 while the output of phosphate fertilizers and potash declined by 7.5% and 2.8% respectively, due to a drop in exports and weak import demand. Entering 2009, the fertilizer industry was confronted with poor market conditions, marked by lack of sales and weak prospects for production and trade this year. However, stocks of soft commodities and cash crops remain low compared with historical levels. Fertilizer demand will therefore recover, although the pace of recovery is uncertain. The International Fertilizer Industry Association forecasts the balance of supply and demand for the next four years, from 2009 to 2013. For the three main nutrients, Nitrogen, Phosphorous and Potassium the supply is projected to grow at an average annual rate of 6%, 8% and 23% respectively.

Price of inputs
Here is a brief description of a few factors that have an impact on production costs. Because ocean shipping rates have been in free fall since May 2008, delivery costs have fallen. Energy prices, notably those of crude oil and natural gas, have fallen by more than half compared to their levels in mid-2008, offering some relief to nitrogen producers. However, in the medium term it appears that natural gas prices in key exporting and importing countries may increase again. The cost of sulphur has an impact on the cost of producing phosphorous.

Since Agrium and other companies in the industry operate internationally, currency valuations may affects costs of inputs and price of outputs. Indeed, as a result of the weakening of the Canadian dollar during the fourth quarter of 2008, Agrium experienced significant foreign exchange gains of $98-million.

Important variables for the industry and their business cycle sensitivity
The most important variable that affects fertilizer demand and price is commodity prices such as corn and wheat. Commodity prices affect the farmers’ revenue and thus willingness and ability to pay for fertilizer. The price of corn is currently around $4 per bushel, double its 2005 price of $2. We must note however, that in the summer of 2008 just before the financial crisis, corn peaked at a price of $7.88 per bushel. High commodity prices are an incentive for farmers to plant more, thus increasing the acres of land cultivated. In addition, higher commodity prices increase the farmers’ willingness and ability to pay for fertilizer.

Prospective Demand
With the prevailing strong agricultural market fundamentals and anticipated progressive recovery of the world economy, world fertilizer demand is seen as slightly rebounding in 2009-10 (+3.6%) to 165.4 metric tons, with growth rates of 2.6% for nitrogen, 6.1% for phosphorous and 4.1% for potassium, as it is shown in the table below. Strong recovery is anticipated in East Asia and in Western and Latin America. Consumption would further increase in South Asia and East Asia going into 2013-14. Although slower growth rates than other regions are anticipated for North America and Western Europe, these regions are still expected to expand. Slower growth in these key areas could diminish Agrium’s future performance compared to other foreign firms.

Disclosure: The author has no position in AGU but intends to initiate one in the coming weeks