Wednesday, September 28, 2011

TreeHouse Foods Inc. (NYSE: THS) Q4 2011 Price Target


Recent price: 66.06$
P/E Ratio: 26.08
3 Months Target Price: 48$

Company Description
According to Reuters, TreeHouse Foods, Inc. (TreeHouse) is a food manufacturer servicing primarily the retail grocery and foodservice distribution channels. The Company’s products include non-dairy powdered coffee creamers, private label soups, salad dressings and sauces, sugar free drink mixes, hot cereals, macaroni and cheese, skillet dinners, Mexican sauces, jams and pie fillings, pickles and related products, infant feeding products, aseptic sauces, refrigerated salad dressings, and liquid non-dairy creamer. TreeHouse operates in three segments: North American Retail Grocery, Food Away From Home, and Industrial and Export. On March 2, 2010, the Company acquired Sturm Foods, Inc. (Sturm), a manufacturer of hot cereals and powdered drink mixes. On October 28, 2010, it acquired S.T. Specialty Foods, Inc. (S.T. Foods), a manufacturer of macaroni and cheese and skillet dinners.


Confidence Margins
Strong resistance $66.03 (-7%)
Light resistance $62.55 (-1%)
Light support $50.02 (+19%)
Strong support $46.73 (+25%)

Recommendation
This company is incredibly overvalued compare to it's more successful peers. Such high levels of valuation, even considering improving fundamentals, cannot justify multiples that are so far away from the industry. TreeHouse Foods Inc will be subject to a correction in the coming quarter.

Entry strategy
For the cautious investor:
Sell short the stock for 65$ or more.

For the risk-taking trader:
The November 2011 50$ out-of-the-money put option contract seems to be the right position to take, they can be acquired for about 55$ per contract.

Exit Strategy
For the cautious investor:
Buy to cover when the stock reaches 48$, or keep it until 46$ if you are more bearish in your own analysis.

For the risk-taking trader:
The contracts should be kept until the underlying reaches 48$. This should provide a good return if the underlying reaches the target price as the contracts will get deep in the money.

DryShips Inc (NASDAQ: DRYS) Q4 2011 Price Target


Recent price: 2.64$
P/E Ratio: 4.16
3 Months Target Price: 5$

Company Description
According to their SEC Filings, DryShips Inc. (DryShips) is a holding company. The Company is engaged in the ocean transportation services of drybulk cargoes and crude oil worldwide through the ownership and operation of drybulk carrier vessels and oil tankers and offshore drilling services through the ownership and operation of ultra-deepwater drilling units. As of April 12, 2011, the Company owned, through its subsidiaries, a fleet of 35 drybulk carriers comprised of seven Capesize, 26 Panamax and two Supramax vessels, which has a combined deadweight tonnage (dwt) of approximately 3.2 million dwt, and had contracts for two Panamax newbuilding drybulk carriers of 76,000 dwt. In May 2010, DryShips agreed to acquire a Panamax vessel, the MV Amalfi (ex Gemini S), which was delivered to the Company in August 2010, and agreed to sell one of its Panamax vessels, the MV Xanadu. In addition, it sold its Panamax vessel, the MV Primera. In August 2011, the Company acquired majority of OceanFreight Inc.


Confidence Margins
Strong resistance $7.11 (+135%)
Light resistance $4.95 (+31%)
Light support $2.52 (-5%)
Strong support $2.11 (-20%)

Recommendation
DryShips is a company that has it's stock subject to a lot of volatility. It however presents an impressive buying opportunity at current price, it is cheaper than on our last analysis. First, profitability is coming back to the company even if capital expenditures are rapidly increasing. The spin-off of the Ocean Rig subsidiary has partially materialized but it will greatly increase shareholder value while reducing the debt load of the holding company.

Entry strategy
For the cautious investor:
Buy the stock for 3$ or less.

For the risk-taking trader:
The January 2011 5$ out-of-the-money call option contract seems to be the right position to take, they can be acquired for about 10$ per contract.

Exit Strategy
For the cautious investor:
Sell when the stock reaches 5$, or keep it until 7$ if you are more bullish in your own analysis.

For the risk-taking trader:
The contracts should be kept until the underlying reaches 5$. This should provide a very interesting return if the underlying reaches the target price as the contracts will get in the money.

Natural Alternatives International, Inc. (NASDAQ: NAII) Q4 2011 Price Target


Recent price: 3.77$
P/E Ratio: 5.35
3 Months Target Price: 6$

Company Description
According to Reuters, Natural Alternatives International, Inc. is a formulator, manufacturer and marketer of nutritional supplements and provides strategic partnering services to its customers. The Company offers a range of nutritional products and services to its clients, including scientific research, clinical studies, ingredients, customer-specific nutritional product formulation, product testing and evaluation, marketing management and support, packaging and delivery system design, regulatory review, and international product registration assistance. It provides private label contract manufacturing services to companies that market and distribute vitamins, minerals, herbs, and other nutritional supplements, as well as other health care products, to consumers both within and outside the United States. It develops, manufactures and markets its branded products under the Pathway to Healing product line.


Confidence Margins
Strong resistance $7.11 (+89%)
Light resistance $4.95 (+31%)
Light support $3.00 (-20%)
Strong support $2.50 (-34%)

Recommendation
Companies operating close to the healthcare industry are not viewed in a favorable manner by Wall Street lately. This provides investors with a good opportunity to invest in a company that is temporarily out of favor. Natural Alternatives International might just prove to be an excellent acquisition.

Entry strategy
For the cautious investor:
Buy the stock for 4$ or less.

For the risk-taking trader:
As the company has no publicly traded option contracts, the use of leverage might be the way to get some excess return on this position.

Exit Strategy
For the cautious investor:
Sell when the stock reaches 6$, or keep it until 7$ if you are more bullish in your own analysis.

For the risk-taking trader:
Same strategy as for the cautious investor.

First Majestic Silver Corp. (NYSE: AG) Q4 2011 Price Target

Recent price: 17.24$
P/E Ratio: 22.68
3 Months Target Price: 27$

Company Description
According to the company itself, First Majestic owns three producing silver mines and two development projects through four separate wholly owned Mexican subsidiaries. The La Encantada Silver Mine is held by Minera La Encantada, S.A. de C.V., the La Parrilla Silver Mine and the Del Toro Silver Mine are held by First Majestic Plata, S.A. de C.V., the San Martin Silver Mine is held by Minera El Pilon, S.A. de C.V., and the La Luz Silver Project is held by Minera Real Bonanza, S.A. de C.V. First Majestic's largest operation; the La Encantada Silver Mine was expanded several times since 2006 to reach the current capacity of 3750 tpd. Production reached close to 3.8 million ounces of silver in 2010 and is anticipated to reach approximately 4.5 million ounces of silver in the form of Dore bars in 2011. 


Confidence Margins
Strong resistance $30.00 (+74%)
Light resistance $26.88 (+56%)
Light support $14.18 (-18%)
Strong support $10.32 (-40%)

Recommendation
Recently, we have witnessed a pullback in the price of precious metals. As long as investors' fears about a potential economic double-dip are not eased, we should see an upside in the price of silver and consequently to price of the stock of companies such as First Majestic Silver Corp. 


Entry strategy
For the cautious investor: 
Buy the stock for 18$ or less. 


For the risk-taking trader: 
The January 2012 30$ out-of-the-money call option contract seems to be the right position to take, they can be acquired for about 55$ per contract. 

Exit Strategy
For the cautious investor: 
Sell when the stock reaches 27$, or keep it until 30$ if you are more bullish in your own analysis. 

For the risk-taking trader: 
The contracts should be kept until the underlying reaches 27$. This should provide a very interesting return if the underlying reaches the target price as the contracts will get in the money.

Monday, August 22, 2011

Hewlett-Packard (HPQ) Is Still Good Without a PC Business

After the release of it's most recent quarterly earnings, and the conference call that came with it. HP's CEO Leo Apotheker has been under constant strain because of the seemingly ill time proposed acquisition of Autonomy. Investors are getting pessimistic about the future of the company and it reflects in the recent selloff that has hit HP's stock. Maybe is it time to take a break from the unending stream of information and be rational about the real long term potential of this company.

For those not in the know, and Reuters provides a very detailed description, Hewlett-Packard Company (HP), incorporated in 1947, is a provider of products, technologies, software, solutions and services to individual consumers, small- and medium-sized businesses (SMBs) and large enterprises, including customers in the government, health and education sectors. Its operations are organized into seven segments: Services, Enterprise Storage and Servers (ESS), HP Software, the Personal Systems Group (PSG), the Imaging and Printing Group (IPG), HP Financial Services (HPFS), and Corporate Investments. Services, ESS and HP Software are reported collectively as a broader HP Enterprise Business. In April 2010, the Company completed its acquisition of 3Com Corporation. In July 2010, the Company completed the acquisition of Palm, Inc. (Palm), In September 2010, the Company acquired Fortify Software. In September 2010, the Company acquired 3PAR Inc., a global provider of utility storage. In October 2010, the Company acquired ArcSight, Inc., a security and compliance management company. The Company’s offerings include multi-vendor customer services, including infrastructure technology and business process outsourcing, technology support and maintenance, application development and support services and consulting and integration services. It also provides enterprise information technology infrastructure, including enterprise storage and server technology, networking products and solutions, information management software and software that optimizes business technology investments; personal computing and other access devices, and imaging and printing-related products and services. It is interesting to note that, at current prices, the company offers the best long term potential among the components of the Dow Jones Index. 

An unfortunate chains of events leading to a 33%+ decline in the stock price of an established company can only mean two things. For one, it could mean that investors might be thinking that the company has seen it's share of growth and are anticipating that the coming years will see a major drop in the company's earnings. Another more frequent reason might be that investors are overreacting to a series of what they assume to be very bad news for the firm. 

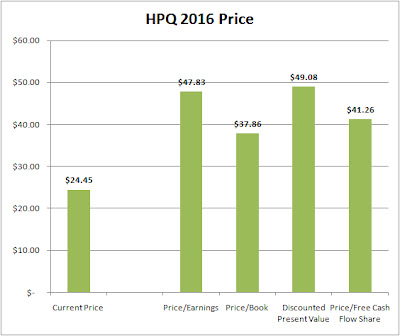
Time will tell which of those two scenarios fits best to reality, but in the meantime, I adhere to a contrarian camp who thinks that HP still has room for even modest growth. Assuming a reasonable P/E ratio of 10, the current price assumes a decrease of HP's earnings of 0.5%% annually over the next 5 years, giving us a 2016 price of 35$. A 8% discount rate would then justify the current 24.45$ at the end of the August 22nd. However, we know that HP has been growing earnings at about 8% a year over the past 10 years, and they went through two recessions over that period. Let's make another assumption and let's say that the acquisition of Autonomy puts some breaks on the growth of HP's earnings and that the company is only able to grow EPS at 5% per annum. We find ourselves with a 2016 price of 48$ per share. 

For the long term investor who is knowledgeable of the tech industry, this must be a great entry price into a company that has rewarded investors with a solid performance in the past 10 years, considering it's seize. With my limited knowledge of this particular industry, I used four different measurements and I came to the conclusion that the current price of HP's stock is overly pessimistic. The earlier stated P/E method gave me a 48$ price tag on shares of HP. 

Interestingly enough, HP has managed to grow it's book value per share over the past 10 years at about 7.5% per year. Assuming they can manage to keep that pace, we end up with a book value of nearly 23$ per share in 2016. At the current depressed Price/Book ratio of 1.6, we end up with a price per share of 38$. 


We can also look at free cash flow per share, which I calculated to have grown about 7% per year over the same period, even if it has been swigging wildly as it can be seen on the above chart. Keeping HP's stock for 5 years and using a 8% discount rate, I ended up with a present value of 49$ per share for HP. Free cash flow per share would end up being about 4$ per share in 2016, If we use a reasonable Price/Free cash flow ratio of 10, we end up with a 2016 price per share of 40$ per share. 

Assuming that my assumptions are not too flawed, it seems to me therefore that the market is being overly bearish on the long term prospects of Hewlett-Packard. Investors are assuming that the current change of strategy will have negative effects on the company, without taking into account that HP might come out of this crisis as a more profitable company. And it will certainly be more profitable if it dumps it's hardware business and stops acquiring companies at absurd premiums to the current price. 


Disclosure: The author has no position in HPQ and does not intend to initiate one in the near future.

Monday, July 11, 2011

ICResearch Q2 2011 Performance (BKS, PHH, QCOR, VVUS, RCL, LL, ODP, EK, BBY, WFC, CREE, AIG, LOGI, PHG, WWE, NYB, LCC, CCL)

InvestingConsultantResearch.com today announced results for the quarterly performance of it's recommendations made for the second quarter of 2011. Here is how those recommendations for Q2 2011 performed since they were issued, ordered by return for the cautious investor if they had been held until market closes at the end of the second quarter of 2011 or when the bid price reached the level provided in the exit strategy.

To be fairly representative of the potential performance, the return presents what an investor would have earned opening the position at the prevailing price when the report was issued and closing it when the bid price of the stock reached the suggested exit point. If the stock did not reach any of the exit levels, the closing price at the end of the quarter is considered to be the selling price.


For the cautious investor:
BKS+ 120%
QCOR+ 85%
VVUS+ 43%
WDC: + 40%
DYAX: + 32%
CRU: + 32%
ARNA: + 30%
IGOI: + 30%
RCL: + 29%
DV: + 29%
EXF: + 27%
EXFO: + 25%
FCN+ 22%
SYNA+ 21%
AXL+ 18%
FBC+ 18%
VCI+ 18%
SANM+ 18%
MDAS+ 17%
LCC+ 17%
SWM+ 15%
FLML+ 15%
RDN+ 13%
LL+ 13%
ORN+ 12%
ODP+ 12%
EK+ 11%
MTOR+ 11%
BORN+ 10%
BBY+ 10%
JACK+ 10%
ENG+ 7%
LOJN+ 7%
PHH+ 7%
FEED+ 5%
XRTX+ 5%
SCCO+ 5%
RJET+ 4%
BPL+ 4%
WFSL+ 4%
NYB+ 4%
WFC+ 2%
FRO+ 1%
HBOS: - 1%
CREE- 2%
PHG- 2%
CCL- 2%
LOGI- 4%
LPS- 6%
RECN- 8%
AIG- 9%
WWE- 11%
SATC- 14%
ANAD- 20%
HSOL- 25%
MTSN- 26%

Average Return: + 13%


Once again, the return presents what an investor would have earned opening the position at the prevailing price of the option contract when the report was issued and closing it when the bid price of the contract reached the suggested exit point. If the stock did not reach any of the exit levels, the closing bid price at the end of the quarter is considered to be the selling price of the option contract.


For the risk taking trader:

Average Return: + 66%


Most of InvestingConsultantResearch.com's picks returned modest performance and some even suffered losses, but the losses were offset by the provided exit strategy. Subscribe to our our site to stay informed for forthcoming recommendations for Q3 and Q4 2011 or follow us on Twitter.

Monday, June 13, 2011

First Financial Bankshares Inc. (NASDAQ: FFIN) Q3 2011 Price Target

Recent price: 32.41$
P/E Ratio: 18.30
3 Months Target Price: 36$

Company Description
According to Reuters, First Financial Bankshares, Inc. is a financial holding company. Through its wholly owned subsidiary, First Financial Bankshares of Delaware, Inc., it owns 11banks, a trust company, a technology operating company, and an insurance agency. As of February 24, 2011, these subsidiaries were First Financial Bank, National Association, Abilene, Texas; First Financial Bank, Hereford, Texas; First Financial Bank, National Association, Sweetwater, Texas;; First Financial Bank, National Association, Eastland, Texas; First Financial Bank, National Association, Cleburne, Texas, and First Financial Bank, National Association, Stephenville, Texas. Through its subsidiary banks, it conducts a full-service commercial banking business. Its service centers are located in North Central and West Texas. As of December 31, 2010, it had 52 financial centers


Confidence Margins
Strong resistance $37.14 (+15%)
Light resistance $35.50 (+10%)
Light support $32.00 (-1%)
Strong support $30.67 (-5%)

Recommendation
This financial holding company has been under pressure as the broad market took a dip. First Financial Bankshares still has some value left and will reward it's investors over the coming weeks.

Entry strategy
For the cautious investor:
Buy the stock for 33$ or less.

For the risk-taking trader:
As the company has no publicly traded option contracts, the use of leverage might be the way to get some excess return on this position.

Exit Strategy
For the cautious investor:
Sell when the stock reaches 36$, or keep it until 37$ if you are more bullish in your own analysis.

For the risk-taking trader:
Same strategy as for the cautious investor.

TD Ameritrade Holding Corp. (NASDAQ: AMTD) Q3 2011 Price Target

Recent price: 18.74$
P/E Ratio: 17.95
3 Months Target Price: 22$

Company Description
According to data provided by Reuters, TD Ameritrade Holding Corporation is a provider of securities brokerage services and technology-based financial services to retail investors, traders and independent registered investment advisors (RIAs). The Company provides services through the Internet, a national branch network and relationships with RIAs. The company is under significant influence by Toronto Dominion Bank.


Confidence Margins
Strong resistance $22.90 (+22%)
Light resistance $21.56 (+15%)
Light support $18.55 (-1%)
Strong support $16.73 (-11%)

Recommendation
As many stock brokers, TD Ameritrade is currently undervalued because of low volume on many stock exchanges. This is a play for those seeing an increase in the trading volume in the coming months.

Entry strategy
For the cautious investor:
Buy the stock for 19.50$ or less.

For the risk-taking trader:
The June 2011 19$ out-of-the-money call option contract seems to be the right position to take, they can be acquired for about 150$ per contract.

Exit Strategy
For the cautious investor:
Sell when the stock reaches 22$, or keep it until 23$ if you are more bullish in your own analysis.

For the risk-taking trader:
The contracts should be kept until the underlying reaches 22$. This should provide a very interesting return if the underlying reaches the target price as the contracts will get in the money.

Tech Data Corporation (NASDAQ: TECD) Q3 2011 Price Target

Recent price: 44.69$
P/E Ratio: 9.81
3 Months Target Price: 50$

Company Description
According to Reuters, Tech Data Corporation is a distributor of information technology (IT) products, logistics management and other value-added services. The Company serves approximately 125,000 value-added resellers (VARs), direct marketers, retailers and corporate resellers in more than 100 countries throughout North America, Latin America and Europe. During the fiscal year ended January 31, 2010 (fiscal year 2009), the Company acquired certain assets of Scribona, AB. In February 2011, the Company announced that it had created two new business divisions: HP Solutions Division And Networking Solutions Group.


Confidence Margins
Strong resistance $54.25 (+21%)
Light resistance $47.62 (+7%)
Light support $42.50 (-5%)
Strong support $41.13 (-8%)

Recommendation
This information technology distributor is currently missing the favor of the market, mostly since the company missed it's first quarter analysts' estimates for its earnings. This event should be seen as a slight mishap and investors will notice that they overreacted to the news. Tech Data Corporation is still profitable and will provide good returns to investors.

Entry strategy
For the cautious investor:
Buy the stock for 45$ or less.

For the risk-taking trader:
The September 2011 45$ out-of-the-money call option contract seems to be the right position to take, they can be acquired for about 270$ per contract.

Exit Strategy
For the cautious investor:
Sell when the stock reaches 50$, or keep it until 54$ if you are more bullish in your own analysis.

For the risk-taking trader:
The contracts should be kept until the underlying reaches 50$. This should provide a very interesting return if the underlying reaches the target price as the contracts will get in the money.

Regency Centers Corporation (NYSE: REG) Q3 2011 Price Target

Recent price: 41.62$
P/E Ratio: -
3 Months Target Price: 47$

Company Description
According to data provided by Reuters, Regency Centers Corporation is a real estate investment trust. The Company is the managing general partner in Regency Centers, L.P., the Operating Partnership. It focuses on owning, operating and investing in a portfolio of primarily grocery-anchored shopping centers that are tenanted by grocers, anchors, specialty retailers, and restaurants located in areas with above average household incomes and population densities. All of the Company’s operating, investing, and financing activities are performed through the Operating Partnership, its wholly-owned subsidiaries, and through its investments in real estate partnerships with third parties. The Company owns 99% of the Operating Partnership.


Confidence Margins
Strong resistance $47.51 (+14%)
Light resistance $46.65 (+12%)
Light support $41.18 (-1%)
Strong support $39.89 (-4%)

Recommendation
Market movements over the past couple of weeks have driven the company to year-to-date lows. At current price levels however, the dividend yield of the company will serve as a break on the slide in the stock price as it gets more and more attracting.

Entry strategy
For the cautious investor:
Buy the stock for 42$ or less.

For the risk-taking trader:
The October 2011 45$ out-of-the-money call option contract seems to be the right position to take, they can be acquired for about 155$ per contract.

Exit Strategy
For the cautious investor:
Sell when the stock reaches 47$.

For the risk-taking trader:
The contracts should be kept until the underlying reaches 47$.